YIMBY
Build more
YIMBY France — The Movement Saying Yes to Housing
Collective op-ed, Les Echos, 18 December 2025.
Every elected official, every activist, every citizen must ask themselves a simple question: which side am I on when it comes to housing? The yes side or the no side? This Manichean framing is no exaggeration. There is no middle way, no “at the same time”, no nuance. Either you slow down housing production and must accept responsibility for worsening the housing crisis, or you decide to increase the housing stock.
Right now, all over France, dressed up in a misguided and exploited environmental virtue, every time a project takes shape, the same reaction: not here. This is the Nimby syndrome, for “not in my backyard”. Some town halls put up posters celebrating the projects they have killed off, while others refuse planning certificates pending revisions that will make the local planning regulations (PLU) even more restrictive.
Under the guise of preserving a living environment, the NIMBY camp has become the coalition of degrowth advocates and speculators, leading to social segregation and urban sprawl. Spurred on by the magnifying effect of social media and the ease of legal challenges, all it now takes is a handful of determined opponents to carry the silent majority with them.
Choosing social justice
But “Nimbyism” is the discourse of those who already have a roof over their heads and slam the door in the faces of those less well off. When households can no longer become homeowners, the housing pathway is blocked, turnover in the private rental stock collapses, and it is households on the move, students leaving the family home, couples going through a separation and workers on the move who pay the price.
In the face of this organised resignation, a counter-movement has emerged: Yimby, for “yes in my backyard”. Yes, we need housing here. Yes to more housing, permanently occupied. Yes to new neighbours, to more neighbours who are present all year round and not just visitors to second homes and holiday lets.
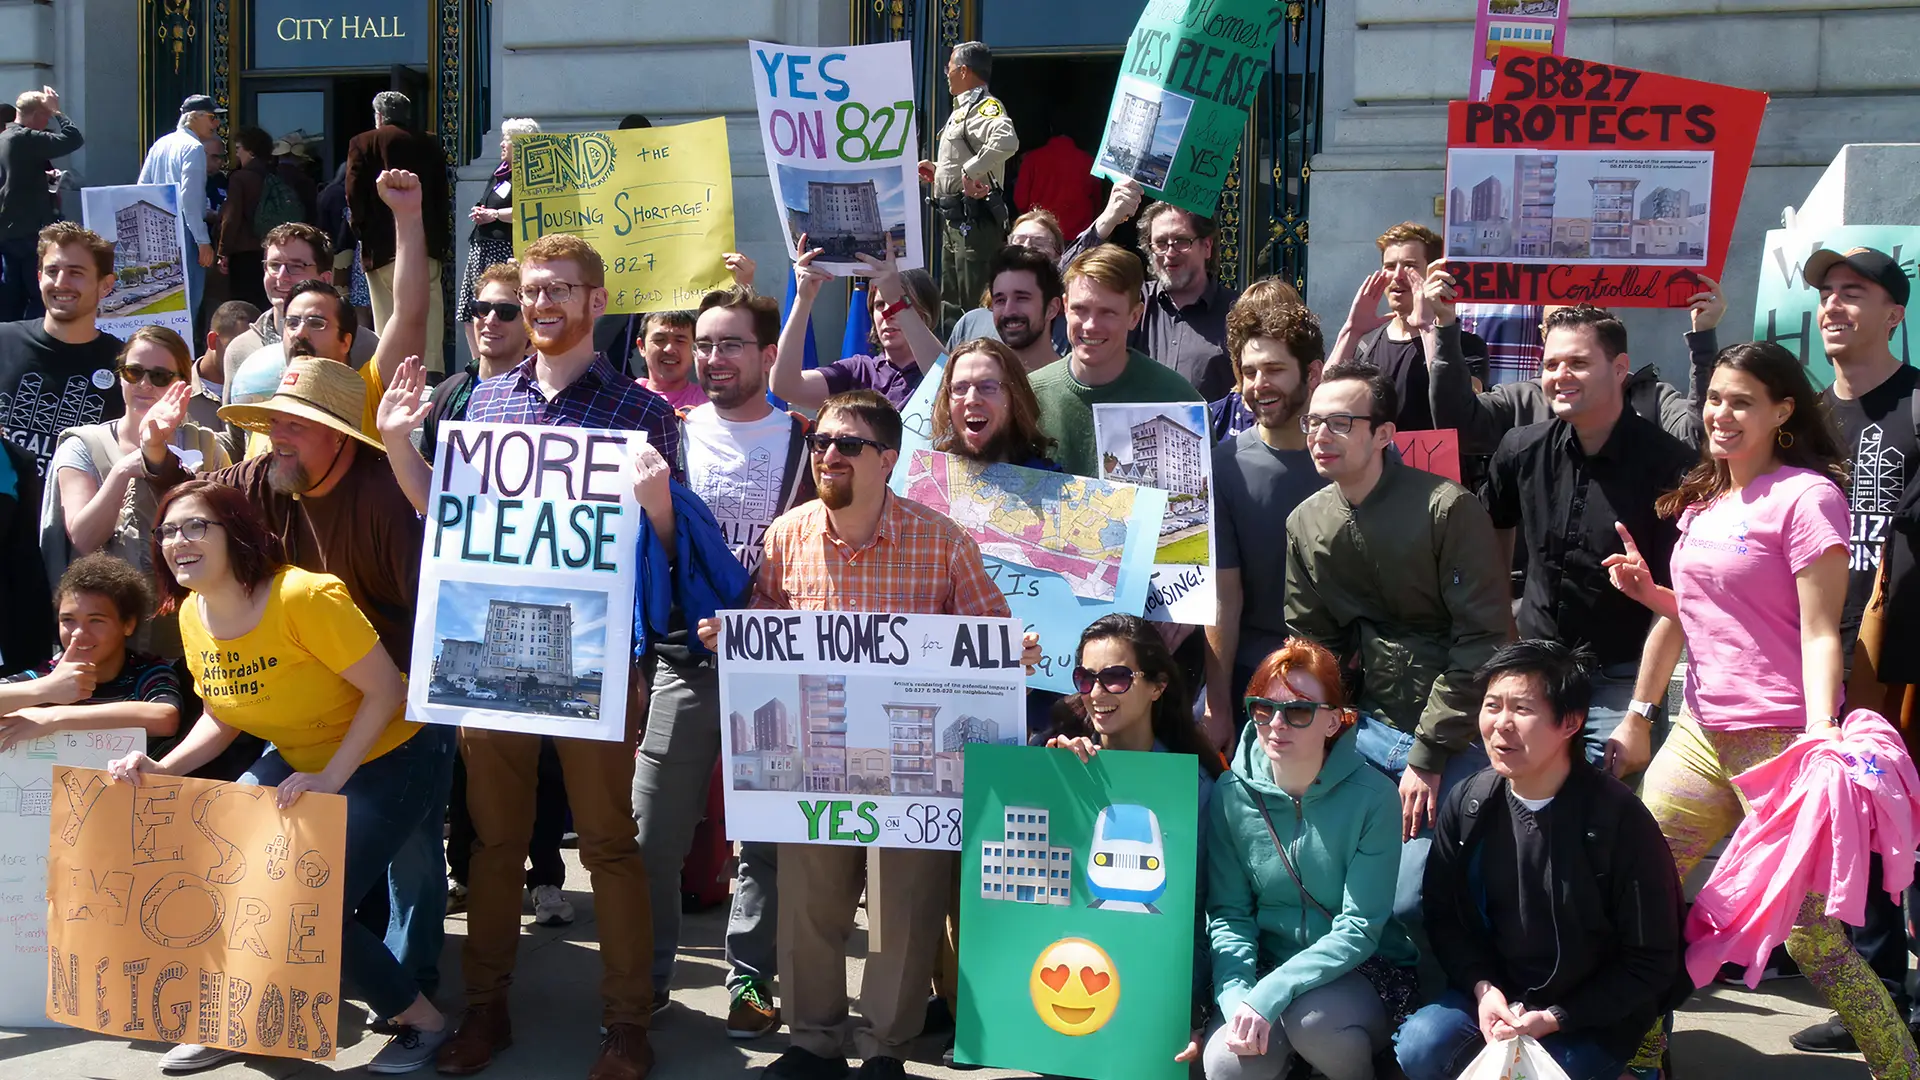
This movement began ten years ago in San Francisco. Faced with yet another petition by homeowners against a property development, tenants responded by declaring that this building was exactly what they needed. What the whole city needed.
The inescapable logic that more supply brings prices down has become a political rallying cry across the spectrum. Cities such as Austin have become laboratories for this public policy. 6.1 permits per 1,000 residents were issued there, six times the national average. The result: in three years, rents have plummeted by 22%.
Being Yimby in France means choosing social justice. It means ensuring that housing is not a luxury good but a product available in sufficient quantity for a population that is still growing and households that are increasingly made up of people living alone. It means fighting social segregation, because not producing also means not producing social housing.
Being Yimby means choosing ecology. It means pushing for renovation. Producing does not necessarily mean building new: it also means repairing, transforming and extending the life of what already exists. Every rehabilitated building, every renovated home, every converted brownfield site helps to fight climate change. The gentle densification of cities, upward extension and the conversion of offices into housing are essential.
Being Yimby means choosing progress. It means rejecting the idea that our cities should become museums. It is a vision of abundance for living neighbourhoods that change, adapt and grow.
The Yimby France movement now champions this vision. It is not about saying yes to just anything. It is about demanding quality projects, creating a new balance of power for citizens in the face of local conservatism, and giving mayors the political courage to let their cities grow. Now. Everywhere.
And if you stand with the NIMBY camp, get ready to face the movement saying yes to housing.
Signatories:
Muriel Boulmier, president of the Union régionale HLM de Nouvelle Aquitaine.
Matthieu Burin, entrepreneur at Hemea.
Denis Caraire, urban planner and president of the Office professionnel de qualification des urbanistes.
Jean Coldefy, mobility expert and chair of the France Mobilité scientific council.
Emmanuelle Cosse, president of the Union sociale pour l’habitat.
Yves Crochet, developer and urban planner.
Bérengère Dubus, head of FI Courtage and founder of the UIC.
Martin Duplantier, architect and president of AMO.
François Gemenne, professor at HEC.
Laure-Anne Geoffroy, president of the Union des architectes.
Jacques Lévy, social science researcher at Chôros.
Julien Meyrignac, urban planner at Public(s).
David Miet, president of Villes Vivantes.
Didier Mignery, architect, director and founder of UPFactor.
Bertrand Moine, entrepreneur at the Observatoire de l’Immobilier.
Philippe Petiot, managing director of Procivis Nouvelle Aquitaine.
Robin Rivaton, entrepreneur and essayist.
Xavier Timbeau, economist at Sciences Po Paris.
Answering those who say we should build less: how to refute the 9 key arguments of the “NIMBY camp”.
France produces only half the housing it needs. Many people think this does not matter. And some even think it is necessary.
On the ground, things are fairly clear: we are not at all on a mission to support housing production.
Setting everything else aside, we should be rescuing projects that have got off to a bad start, increasing densification rights in local planning regulations (PLU), speeding up the favourable processing of building permit applications…
But no. Instead: endless discussions with officials, elected representatives, neighbours, experts… Why these endless discussions?
Because we are entangled in the ideological nets of the “NIMBY camp”. We have to struggle in a web of false ideas.
Here is a list of 9 of these ideas. Each of them:
✼ Follows reasoning that is false;
✼ Helps to consolidate the NIMBY position, that is, the position of those who want less to be built “here”;
✼ Is supported by certain professionals, researchers, elected representatives and neighbours, who are not the majority, but who are today the best equipped to assert their position.
The “NIMBY camp”, the one that opposes building more, will always say that its aim is not to oppose construction but rather to pursue a nobler goal: ecological and social in particular.
But in practice:
✼ defending these 9 ideas provides new alibis for those who want less to be built;
✼ the more virtuous the cause defended appears, the more powerful these alibis are in their capacity to oppose construction projects.
That is why we are going to have to dismantle each falsehood, one by one. Drawing on science, which, fortunately, has been publishing extensively in recent years.
1. “The French population is going to decline, so the need for new housing is going to collapse” = FALSE
2. “With no net land take, there is no room left, so we have no choice but to build less” = FALSE
4. “To bring prices down, it is not quantity that counts but quality, so building more is pointless” = FALSE
6. “We need to plant more, so we need to build less” = FALSE
8. “We need to save soils and biodiversity, so we need to build less” = FALSE
9. “We need to cool our cities, so we need to build less” = FALSE
1. “The French population is going to decline, so the need for new housing is going to collapse” = FALSE
This reasoning does not hold up, for 4 reasons that all stem from one main fact: housing need does not come mainly from population growth but from sociological and geographical change in the population.
1.1. “Household splitting” creates additional households and therefore a need for new housing, even without population growth.
Key concepts
✼ Household splitting: the shift from one household to several. A young person leaves the parental home, a couple separates, an older person remains alone in their home after being widowed: each time, one household becomes two, and each needs a roof over its head.
✼ Demand: household splitting is the silent driver of housing demand. Average household size is falling, so the number of households is rising, even with a constant population.
Key figures
✼ 2.14 people: this was the average household size in 2023 (INSEE-SDES, the French national statistics institute and the statistics service of the French ministry for the environment). Here is how it has changed: 2.29 in 2008, 2.20 in 2018, projected at 2.07 in 2030 and 1.99 in 2050.
✼ 3.6 million households: in metropolitan France, the number of households is expected to rise by 3.6 million between 2020 and 2050. This increase is driven almost exclusively by people living alone: +3.4 million, the majority of them over 60 (SDES & INSEE, household projections, central scenario).
Key references
✼ SDES, Projections du nombre de ménages à horizon 2030 et 2050 [Projections of the number of households to 2030 and 2050], Working Paper no. 64, December 2023. ↗
✼ Insee Focus no. 317, De 2 à 6 millions de ménages supplémentaires en France entre 2018 et 2050 [From 2 to 6 million additional households in France between 2018 and 2050], January 2024. ↗
Further reading
✼ Des millions de logements à reconfigurer et créer dans les années à venir [Millions of homes to reconfigure and create in the years ahead] ↗
1.2. We have been falling behind on housing production for many years in high-pressure areas.
Key concepts
✼ Housing needs are a flow: births happen every day, so do separations, so do children leaving home to study, etc. When it comes to housing, there can therefore be no “pause” and no “moratorium”.
✼ Cumulative deficit: when production falls short, as it does today, the shortfall recorded in any given year will therefore have to be made up, cumulatively, through production in the following years.
Key figures
✼ From 1.1 to 1.4 million homes: this is the cumulative deficit. Estimates range from 1.1 million homes (Mouillart, 2023) to 1.36 million (ESCP, a French business school, cited by Driant, 2023).
✼ 1.4 million households: this is also the number of households without housing or living in very poor housing conditions. (Boutchenik & Rateau, Besoins en logements à horizon 2030, 2040 et 2050 [Housing needs to 2030, 2040 and 2050], SDES, June 2025)
Key references
✼ Rapport Rebsamen — Commission pour la relance durable de la construction de logements [Rebsamen Report — Commission for the Sustainable Revival of Housing Construction], Volume 1, September 2021. ↗
✼ Union sociale pour l'habitat & Habitat & Territoires Conseil. (2023). Quels besoins en logements sociaux à l'horizon 2040? [What will social housing needs be by 2040?] Study presented at the 83rd Congrès Hlm (the congress of the French social housing movement), Nantes, October 2023. ↗
✼ Conseil national de l'habitat. (2023). Analyse des besoins en logement — Synthèse des travaux du groupe de travail [Analysis of housing needs — Summary of the working group's findings]. December 2023. ↗
Further reading
✼ Urbanisme: comment faire perdre 15 ans à la France [Urban planning: how to make France lose 15 years] ↗
1.3. The French move house and change region, and the shifting geography of demand creates new needs.
Key concepts
✼ The immobility of housing: households that move cannot take their homes with them. The housing stock therefore exists only at local level: surpluses in areas that are emptying cannot make up for deficits in areas that attract people.
✼ Demand linked to moving house: each geographical reshaping of demand therefore creates a need for new construction, even with a constant national population.
Key figures
✼ 6 million people: in 2023, 8.8% of the population moved within the country, or around 6 million people. (INSEE, the French national statistics institute, Insee Première no. 2073, 2025)
✼ 105 km: a quarter of people who move to a different municipality now travel more than 105 km, compared with 88 km before the Covid-19 crisis. (INSEE, Insee Première no. 2073)
✼ 0.5%/year: between 2013 and 2023, Brittany, Occitanie and Nouvelle-Aquitaine each gained more than 5 residents per 1,000 residents per year through residential mobility alone. (INSEE, Insee Première no. 2073)
Key references
✼ Brutel, C. (2023). En 2021, des déménagements un peu plus nombreux qu'avant la crise sanitaire depuis l'Île-de-France vers les autres régions [In 2021, slightly more moves than before the Covid-19 crisis from Île-de-France to other regions]. Insee Première, no. 1954, June 2023.
✼ Pouvreau, L. (2025, September 18). La Côte Ouest française face à son potentiel démographique [The French West Coast and its demographic potential]. Organic Cities II, Rennes. Sciences Po Rennes & Villes Vivantes. ↗
✼ Buhnik, S. (2024, January 18). Des poches de croissance dans un océan de décroissance [Pockets of growth in an ocean of decline]. Organic Cities, Paris. Sciences Po & Villes Vivantes. ↗
Further reading
✼ L'éléphant dans la pièce: la géographie de l'emploi [The elephant in the room: the geography of jobs] ↗
✼ On va manquer de logements… dans un pays où la population ne croît presque plus [We are going to run short of housing… in a country where the population has almost stopped growing] ↗
✼ Urbanisme: comment faire perdre 15 ans à la France [Urban planning: how to make France lose 15 years] ↗
1.4. Half of the fall in the birth rate is due to the housing crisis, so it cannot be used as a pretext for pursuing a policy of reducing housing production.
Key concepts
✼ Reversed causality: fewer births, so fewer homes needed? Causal studies show the opposite mechanism: it is the shortage of housing, particularly affordable family housing, that drives births down. Reducing production on the grounds of demographic decline therefore feeds the very decline being invoked.
Key figures
✼ 51%: the rise in housing costs since 1990 alone accounts for 11% fewer births in the United States, or 51% of the total decline in fertility between the 2000s and the 2010s. (Couillard, 2025)
✼ 33%: in Brazil, access to housing increases the probability of having a child by 3.8% and the number of children by 3.2%. For 20–25-year-olds, the effects reach +32% and +33%. (Van Doornik et al., 2024)
✼ 20 years old: timing is decisive: the completed fertility of a household that gains access to housing at 20 is twice that of a household that does so at 30. When access to housing is delayed, there will ultimately be fewer children. (Van Doornik et al., 2024)
Key references
✼ Couillard, B. K. (2025). Build, Baby, Build: How Housing Shapes Fertility. Working paper, Department of Economics, University of Toronto. ↗
✼ Van Doornik, B., Fazio, D., Ramadorai, T., & Skrastiņš, J. (2024). Housing and Fertility. CEPR Discussion Paper no. 19805 / Central Bank of Brazil, Working Paper no. 612. ↗
✼ Moine, B. (2026), Étude logement & natalité, L'impact du blocage du marché immobilier sur la démographie française [Housing & birth rate study: the impact of the blocked property market on French demographics]. ↗
Further reading
✼ La chute des naissances viendrait pour moitié du manque de logements [Half of the fall in births may be due to the housing shortage] ↗
✼ Accès au logement et natalité: une relation causale démontrée au Brésil [Access to housing and the birth rate: a causal relationship demonstrated in Brazil] ↗
✼ Sobriété immobilière et baisse des naissances: la boucle serait-elle bouclée? [The politics of housing scarcity and falling births: has the loop been closed?] ↗
2. “With no net land take, there is no room left, so we have no choice but to build less” = FALSE
This reasoning does not hold up because in France the densification potential of the places where the French need to live is both unlimited and artificially blocked by a kind of numerus clausus.
2.1. The potential of gentle densification is theoretically unlimited. It can be developed incrementally through small projects led by private individuals.
Key concepts
✼ Project owner: the project owner of a construction project is the legal entity or individual that acquires a plot and entrusts construction to a designer-builder and building contractors. The project owner owns the building during the construction phase. In France, housing is produced either by private individuals (residents as project owners) who build for themselves or to rent out, or by private developers, who are the project owners of schemes they build to sell on, or by social landlords.
✼ Owner-led development: this is the share of housing produced by private individuals acting as project owners. Most often, they have a detached house built, and sometimes one, two or three flats for relatives or to rent out. Not to be confused with self-build, where the resident carries out all or part of the construction work themselves. Owner-led development simply means doing the project owner's work oneself: that is, signing a contract with a designer-builder and building contractors.
✼ Affordable housing: in France in recent decades, affordable housing has been produced through the owner-led development supply chain, which saves delegated project-management fees, significant marketing costs and the property developer's margin, a typical difference of €500 to €1,500/m² built depending on the market (Pouvreau, 2024). Other affordable housing supply chains exist but are more limited in volume because they are more complex and consume more public funding: social home ownership (PSLA, a French lease-to-buy scheme), bail réel solidaire (BRS, a French long-term lease that separates ownership of the land from ownership of the home), etc.
✼ Housing developments VS piecemeal plots: these are the two supply chains for building plots that can be bought by a private individual to be built on through owner-led development, and therefore the two supply chains for detached houses, which are also the two historical supply chains for affordable housing. In the case of a “housing development”, a land developer buys a site, services it (utility networks, roads) and sells building plots one by one to private individuals who will have a house built. In the case of “piecemeal plots”: a private individual who owns land in a buildable zone divides it and sells part of it to another private individual, who will connect it to the utility networks and have a house built.
✼ No net land take: in 2021, the Climate and Resilience Law introduced the principle of no net land take, with the aim of halting all land take on new land by 2050. In the meantime, local authorities have a timetable for progressing towards this objective through their planning documents and their local planning regulations (PLU). While this principle is highly debatable for industrial and business land, it is rather sensible and realistic for housing. In particular, it will constrain the production of building plots through housing developments and piecemeal plots in urban expansion areas.
✼ Gentle densification: gentle densification is a set of methods that consists of rebuilding an owner-led development supply chain (affordable housing with private individuals as project owners), this time by densifying the existing city rather than through urban expansion. Gentle densification operates either through dense development schemes (BAMBA), or through piecemeal densification of existing areas, by adding new buildings on already built plots or through plot division to create new building plots (BIMBY), or through the transformation and reconfiguration of existing buildings (BUNTI).
Key figures
✼ 30 to 50% of affordable housing. Since 1980, the production of detached houses through owner-led development (residents as project owners) has accounted for between 30 and 50% of total new housing production in France, depending on the year. It is an absolutely fundamental supply chain that is being hit head-on by no net land take and that must be redeployed through densification, by opening up gentle densification rights in PLUs.
✼ 200 m². This is the plot size that 2/3 of French people would be willing to accept today (IFOP-FFC, a French polling institute and the French federation of house builders, 2024), whereas plots bought for building average 924 m² (SDES, the statistics service of the French ministry for the environment, EPTB building plot price survey, 2020), and millions of existing houses occupy plots of more than 1,000 m². The gap between the size of existing gardens and households' actual aspirations is precisely the untapped reserve for gentle densification.
✼ 1%/year. France has 20 million detached houses already built. If each year 1 owner in 100 decides to share their land to sell a building plot, that means 200,000 new houses can be built, 3 times the current (2025) volume of house production in France and the equivalent of the volume produced in the best years for detached houses in France (2007).
✼ 9 million plots. Of these 20 million houses, 9 million are located in municipalities with more than 10,000 people and their neighbouring municipalities. This is therefore a stock of at least 9 million potential building plots available in well-equipped, strategic areas.
✼ 55% (+10 points in 2 years). The leading player in detached house construction, HEXAOM, already produces today (2024) more than half of its output on plots resulting from plot division. The great redirection of the owner-led development supply chain from urban expansion towards urban intensification is under way.
Key references
✼ Pouvreau, L. (2024, January 18). L'auto-promotion accompagnée: un modèle économique pour la production massive de logements abordables en France [Supported owner-led development: an economic model for the mass production of affordable housing in France]. Organic Cities, Paris. Sciences Po & Villes Vivantes. ↗
✼ Hernandez, A., & Caraire, D. (2024, January 18). BIMBY et BUNTI: faire des habitants les maîtres d'ouvrage de la transformation des tissus urbains et ruraux [BIMBY and BUNTI: making residents the project owners of the transformation of urban and rural fabric]. Organic Cities, Paris. Sciences Po & Villes Vivantes. ↗
✼ Hanss, T. (2025, September 19). La densification douce de la côte ouest: peut-on produire 50% de logements abordables en coopérant avec les habitants? [Gentle densification on the west coast: can we produce 50% affordable housing by cooperating with residents?]. Organic Cities II, Rennes. Sciences Po Rennes & Villes Vivantes. ↗
✼ Pouvreau, L. (2025, September 18). La Côte Ouest française face à son potentiel démographique [The French West Coast and its demographic potential]. Organic Cities II, Rennes. Sciences Po Rennes & Villes Vivantes. ↗
✼ Fédération française des constructeurs de maisons individuelles & IFOP. (2024, March). Le regard des Français sur la maison individuelle et l'accès à la propriété [How the French view the detached house and home ownership]. ↗
✼ HEXAOM. (2025, April). HEXAOM valorise le foncier avec la division parcellaire! [HEXAOM makes the most of land through plot division!] ↗
✼ SDES. (2021). Enquête sur le prix des terrains à bâtir (EPTB) 2020 [Survey of building plot prices (EPTB) 2020] — average size of plots bought for building: 924 m². ↗
Further reading
✼ La densification douce fait son chemin [Gentle densification is gaining ground] ↗
✼ Épernay: retrouver une abondance foncière en réalisant le ZAN [Épernay: regaining an abundance of land while achieving no net land take] ↗
✼ La densification douce: mode d'emploi [Gentle densification: a user's guide] ↗
✼ La densification douce, ou la miniaturisation de l'industrie immobilière à l'heure du ZAN [Gentle densification, or the miniaturisation of the property industry in the era of no net land take] ↗
✼ Passer de 17 à 19 logements par hectare en 10 ans: augmenter l'offre sans affecter le cadre de vie [Going from 17 to 19 homes per hectare in 10 years: increasing supply without affecting the living environment] ↗
2.2. The potential of intensive densification is theoretically unlimited. It can be developed in high-pressure and very high-pressure areas.
Key concepts
✼ Intensive densification: this is the second supply chain for “building without sprawl”. Whereas gentle densification operates with residents as project owners, plot by plot, intensive densification operates with developers as project owners: assembling several plots, building small or large apartment buildings, upward extensions of existing buildings, converting offices into housing. The two supply chains are complementary: gentle densification works in all areas, intensive densification in areas where sale prices make schemes financially viable.
✼ Marketability threshold: given construction costs, a new-build development scheme can only be sold in areas where new-build homes sell for at least €4,000/m². Given the price gap between existing and new-build homes, this corresponds to areas where prices for existing homes exceed €3,500/m². This threshold maps out the geography of intensive densification: the areas where it can operate are not extensive, but they are the most strategic in the country.
Key figures
✼ €4,953/m²: this is the average price of new-build flats sold in France in the 2nd quarter of 2025 (SDES, ECLN survey of new-build housing sales): well above the theoretical marketability threshold of €4,000/m².
✼ 7% of the country's land area: the areas where prices for existing homes exceed €3,500/m² cover only 7% of the country's land area. These are the densest and most sought-after areas in the country. They concentrate (Villes Vivantes, based on INSEE, the French national statistics institute, and DVF, French open data on property transactions, 2014–2020 period): 32% of the housing stock and 32% of the population, 37% of jobs, 49% of French population growth, 38% of total housing production, and 55% of flat production, the typical product of intensive densification.
✼ 86%: this is the share of the stock of new-build homes offered for sale by developers that is located in high-pressure zones A bis, A and B1 (categories of the French housing-market zoning system) (SDES, ECLN, 2nd quarter of 2025). The geography of property development follows that of prices.
Key references
✼ SDES. (2025). Commercialisation des logements neufs — Vente aux particuliers au 2e trimestre 2025 [Marketing of new-build housing — Sales to private buyers in the 2nd quarter of 2025]. ↗
✼ Rapport Rebsamen — Commission pour la relance durable de la construction de logements [Rebsamen Report — Commission for the Sustainable Revival of Housing Construction], Volume 1, September 2021. ↗
Further reading
✼ Compte à rebours de l'opérateur et logiques foncières [The developer's residual land valuation and the logic of land markets] ↗
✼ Comment réguler le prix du foncier? [How can land prices be regulated?] ↗
2.3. The scarcity and high cost of land are today created artificially by rules written into PLUs, most often under pressure from local residents campaigning for the status quo (NIMBY).
Key concepts
✼ PLU (local planning regulations): this is the regulatory document that sets building rights, plot by plot: heights, building footprints, setbacks, access, parking, open-ground ratio, etc. Buildable land is therefore not a geographical given, but above all a regulatory creation. With each PLU revision, a local authority decides, through complex geometric rules, how much housing it will be legal to build in its area. The shortage of buildable land in high-pressure areas is the product of this regulatory drafting, which is technical and almost invisible to citizens.
✼ NIMBY (“not in my backyard”): refers to opposition by already-housed local residents to any construction project near their homes. NIMBYism is not only expressed against projects, case by case: it is written into regulations. Under pressure from a few determined opponents, successive PLU revisions reduce building rights, neighbourhood by neighbourhood: a numerus clausus on land that organises scarcity and drives up prices, to the benefit of existing owners.
✼ YIMBY (“yes in my backyard”): the counter-movement, born in San Francisco ten years ago, which calls for construction to be legalised where the need exists. Being YIMBY means calling for building rights to be reopened in areas that are well equipped, well served and in demand.
Key figures
✼ -14%: production trends have reversed geographically: planning approvals for construction are down 14% in the highest-pressure zones (A bis, A, B1) compared with 2018, while they are up 22% in zones B2 and C (Rebsamen Report, 2021). France is building less and less where the need is most acute.
✼ Twice as much, at comparable density: in Mérignac, at the heart of the Bordeaux metropolitan area, older houses sell for around €4,000/m²; in Périgueux, €2,000/m², even though Périgueux's residential density is 20% higher than Mérignac's. The price difference does not come from density: it comes from higher demand in Mérignac combined with rules that prevent Mérignac from densifying.
Key references
✼ Rapport Rebsamen — Commission pour la relance durable de la construction de logements [Rebsamen Report — Commission for the Sustainable Revival of Housing Construction], Volume 1, September 2021. ↗
✼ Derrière la crise du logement, une crise de la planification [Behind the housing crisis, a planning crisis] ↗
Further reading
✼ Comment nous avons créé la pénurie artificielle de foncier constructible [How we created the artificial shortage of buildable land] ↗
✼ Not In My BackYard (NIMBY) ↗
✼ Le NIMBY contre l'efficacité foncière? [NIMBYism versus efficient land use?] ↗
✼ Le NIMBY éloigne les moins diplômés de l'emploi [NIMBYism pushes the less qualified further away from jobs] ↗
✼ La mise sous cloche du tissu pavillonnaire n'est pas soutenable [Freezing single-family neighbourhoods is not sustainable] ↗
✼ Nous n'avons pas 10 ans pour résoudre la pénurie de foncier constructible [We do not have 10 years to resolve the shortage of buildable land] ↗
✼ Du choc d'interdiction de la densification… au choc de légalisation du village dense [From the shock of banning densification… to the shock of legalising the dense village] ↗
2.4. NIMBYism is powerful, but it is a minority. It can be overcome: by demonstrating the individual benefits of densification, and through the beauty of the schemes.
Key concepts
✼ Hard NIMBY: opinion studies distinguish systematic opponents of any construction (the “hard NIMBYs”) from the rest of the population. The former are a minority. The majority of residents are in favour of building housing, or have simply never been asked: NIMBYism wins local decisions because the other side fails to mobilise, not through numbers.
✼ Supply scepticism: part of the opposition does not deny the need, but doubts that building helps. Yet the public understands the law of supply and demand perfectly well in other markets (food, cars, labour); it is only with housing that intuition becomes blurred, with rising prices attributed to moral causes (speculation, manipulation) rather than to scarcity.
✼ Individual benefits of densification: NIMBYism thrives when densification is experienced as an imposed threat. It recedes when each owner discovers what it can bring them personally: funding their retirement or their home improvements by selling off a plot, building for a child or a parent, adapting their house for old age. Gentle densification turns local residents from opponents into project owners: part of NIMBYism dissolves into the project.
✼ Beauty: part of the opposition to densification is aesthetic, and it is legitimate: standardised schemes have damaged trust. Bespoke densification, designed project by project with residents, produces ordinary beauty: that of the village, the dense form the French already love.
Key figures
✼ 3 to 1: when the whole population is surveyed, and not just those who attend public meetings, supporters of housing construction clearly prevail — around 74% of American homeowners and 80% of American renters support policies that encourage housing construction (Zillow, 2023). “Hard NIMBYs”, opposed even to the gentlest forms of densification, account for at most 30% of respondents.
✼ 70% of 25–34-year-olds. The gap is generational and linked to property ownership: opposition to projects increases with age and with being a homeowner. In Santa Monica, 70% of 25–34-year-olds viewed downtown development positively, while 68% of 60–64-year-olds opposed it. Surveys at public meetings reverse the picture: opponents turn up, supporters do not.
✼ Only 30 to 40% of Americans believe that building more brings prices down, whereas they answer the same question correctly when it is asked about wheat, cars or labour (Nall, Elmendorf & Oklobdzija, 2024). Supply scepticism is a cognitive exception specific to housing.
Key references
✼ Les hard NIMBYs sont minoritaires [Hard NIMBYs are a minority] ↗
✼ Que se passe-t-il lorsque l'on s'adresse aux partisans de la construction de logements? [What happens when we reach out to supporters of housing construction?] ↗
✼ Le NIMBY, une question de peurs, qui affecte moins les jeunes que les baby-boomers [NIMBYism, a question of fears, which affects young people less than baby boomers] ↗
✼ Nall, C., Elmendorf, C. S., & Oklobdzija, S. (2024). Folk Economics and the Persistence of Political Opposition to New Housing. ↗
Further reading
✼ Nous aimons la densité lorsqu'elle est douce et vivante [We love density when it is gentle and lively] ↗
✼ La beauté ordinaire est un cercle vertueux [Ordinary beauty is a virtuous circle] ↗
✼ Nos villes contemporaines gagneraient à être personnalisées [Our contemporary cities would benefit from being personalised] ↗
✼ Urbanisme organique: le ZAN sera beau [Organic urbanism: no net land take will be beautiful] ↗
✼ Réinventer et généraliser le village [Reinventing the village and making it widespread] ↗
✼ La “maison”, et le modèle urbain du “village”, sont l'avenir du logement en France [The “house” and the “village” urban model are the future of housing in France] ↗
✼ Pour le logement et le futur des jeunes: légalisons le village! [For housing and the future of young people: let's legalise the village!] ↗
3. “Building less means fewer resources consumed and fewer greenhouse gases emitted, so it shows ‘sobriété’ (usually rendered as ‘sufficiency’), and therefore it is better” = FALSE
This reasoning rests on a truncated carbon footprint: it counts the emissions from construction (a one-off item) and forgets the dominant item, the mobility emissions induced by the housing’s location, accumulated over its entire lifespan.
3.1. Over a 40-year life cycle, 59 to 86% of a home’s carbon footprint is attributable to the carbon-intensive mobility induced by its spatial location.
Key concepts
✼ A home’s full carbon footprint: a home’s footprint does not stop at its construction. It combines four items: construction, maintenance, operation (heating, cooling) and the daily mobility of its residents. Construction emits once; journeys recur every year, for forty or fifty years. Their emissions depend on a single variable: location.
✼ Location-induced emissions: the same household, in the same home, does not emit the same amount depending on where that home is located. In the heart of the urban area, distances are short and alternatives to the car exist; on the outer fringes, every daily activity requires motorised kilometres. Location is a carbon decision with long-term consequences.
Key figures
✼ 59 to 86%: for a household of four, this is the share of daily mobility in the overall CO2 emissions linked to housing and its location, over a 40-year life cycle, the remainder being due to construction, maintenance and operation (modelling on a 200-metre grid, SCoT (a French sub-regional strategic plan) La Rochelle Aunis).
✼ 1.4 to 6.1 times: the choice of a home’s location weighs 1.4 to 6.1 times more heavily, in emissions, than its construction, maintenance and operation combined.
✼ From 1 to 4 depending on place of residence alone: the annual mobility emissions of a household of four rise from 3.4 tonnes of CO2 in La Rochelle to 6.2 tonnes in Dompierre, 9.2 tonnes in Yves and 14.7 tonnes on the outer fringes.
Key references
✼ Lempérière, P., Miet, D., Parodi, M., Pouvreau, L., Stuhlfauth, V., & Timbeau, X. (2023). Sur le cycle de vie d'un logement, les émissions de mobilité induites par sa localisation sont très largement supérieures à celles liées aux postes de construction, de maintenance et d'exploitation cumulés [Over a home’s life cycle, the mobility emissions induced by its location far exceed those of construction, maintenance and operation combined] [pre-print]. ↗
✼ Lempérière, P., Miet, D., Parodi, M., Pouvreau, L., Stuhlfauth, V., & Timbeau, X. (2023). SCoT La Rochelle Aunis: les émissions moyennes des habitants du territoire pour leurs mobilités quotidiennes [SCoT La Rochelle Aunis: the average emissions of the area’s residents from their daily mobility] [pre-print]. ↗
Further reading
✼ Quel est l'impact carbone de notre incapacité à accueillir les habitants qui le souhaitent dans le cœur des grandes agglomérations? [What is the carbon impact of our inability to accommodate residents who wish to live in the heart of large urban areas?] ↗
3.2. From the 5th year onwards, building a new, well-located home in the heart of the urban area produces lower overall CO2 emissions than renovating a home located on the periphery.
Key concepts
✼ The new-build versus renovation debate, re-examined: “always renovate before building” is a slogan that only holds if we compare two homes in the same place. As soon as the mobility induced by location is factored in, the balance is reversed: the emissions avoided by renovating an outlying home are caught up with, then exceeded, by its residents’ mobility emissions. The right question always has two parts: what to build or renovate, and where.
✼ Tipping point: this is the year from which the cumulative emissions (construction + operation + mobility) of a well-located new home fall below those of a poorly located renovated home. Building a house “costs” around 50 tonnes of CO2 once; a poor location costs several tonnes every year, for the whole lifespan of the house.
Key figures
✼ From the 5th year onwards, building a new home for a couple with children in La Rochelle becomes better overall, in cumulative emissions, than renovating a home in Yves, in the outer suburbs.
Key references
✼ Lempérière, P., Miet, D., Parodi, M., Pouvreau, L., Stuhlfauth, V., & Timbeau, X. (2023). Sur le cycle de vie d'un logement, les émissions de mobilité induites par sa localisation sont très largement supérieures à celles liées aux postes de construction, de maintenance et d'exploitation cumulés [Over a home’s life cycle, the mobility emissions induced by its location far exceed those of construction, maintenance and operation combined] [pre-print]. ↗
✼ Miet, D. (2024, January 19). Devrions-nous rénover tous les bâtiments bien que certains soient éloignés des centres urbains ou construire plus de logements neufs au cœur des agglomérations? [Should we renovate all buildings even though some are far from urban centres, or build more new homes in the heart of urban areas?] Organic Cities, Paris. Sciences Po & Villes Vivantes. ↗
Further reading
✼ Le prix du carburant est national. Son impact, lui, est territorial. [The price of fuel is national. Its impact is local.] ↗
3.3. Densifying, enabling residents to live in the strategic, well-located and well-served places in our areas, is our primary lever for reducing the carbon emissions linked to everyday lifestyles.
Key concepts
✼ Location as climate policy: public policies focus their efforts on building performance (insulation, RE2020 (the French environmental building regulations)) and on vehicle technology (electric vehicles). The third lever, the most powerful, remains the blind spot: bringing residents closer to jobs, services and networks. Every household accommodated in the heart of the urban area rather than on the distant periphery represents an emissions differential secured for decades, with no daily effort and no new technology.
✼ Blocking here means emitting elsewhere: refusing construction where the jobs are does not remove the need for housing but shifts it to more distant areas, more dependent on the car. NIMBYism in the hearts of urban areas is a machine for manufacturing peri-urban emissions.
Key figures
✼ From 3.4 to 14.7 t CO2/year of mobility for the same household of four depending on its municipality of residence (SCoT La Rochelle Aunis): every home accommodated in the centre rather than on the outer fringes “saves” up to 11 tonnes of CO2 per year, which is more, in five years, than the construction of the home itself.
Key references
✼ Timbeau, X. (2025, September 18). Densifier pour accueillir plus, une opportunité pour le climat? [Densifying to accommodate more people: an opportunity for the climate?] Organic Cities II, Rennes. Sciences Po Rennes & Villes Vivantes. ↗
Further reading
✼ Pour diviser par 2 l'empreinte carbone de la mobilité des Français, il faudra construire [To halve the carbon footprint of French people’s mobility, we will have to build] ↗
✼ Pourquoi la dispersion territoriale sabote notre politique climatique [Why territorial dispersion is sabotaging our climate policy] ↗
3.4. Token “sobriété” triggers harmful rebound effects.
Key concepts
✼ Sufficiency, not austerity: the French word “sobriété” is an unfortunate translation of “sufficiency”, which means “in sufficient quantity”. The concept of sufficiency calls for producing what is necessary, no more, no less. Applied to housing, it requires producing the homes that households need, where they need them. French-style “sobriété”, on the other hand, has slipped towards a moral imperative of minimal production, which organises shortage under the banner of “less is better”.
✼ Territorial rebound effect: a home refused here does not disappear; it is built elsewhere, further away, where land remains affordable, with the car kilometres that go with it. The “sobriété” of a central municipality is paid for in sprawl and emissions in the peri-urban ring. The consolidated footprint of the area is worse than if the municipality had accommodated the housing.
✼ Budgetary rebound effect: the money that an economic actor saves (or thinks it saves) here is reallocated to other forms of consumption, which may be more carbon-intensive. A policy that claims to reduce emissions by reducing production shifts carbon instead of eliminating it.
Further reading
✼ “Sobriété” est une traduction malheureuse du mot “sufficiency” qui veut dire “en quantité suffisante” [“Sobriété” is an unfortunate translation of the word “sufficiency”, which means “in sufficient quantity”] ↗
✼ Un logement refusé ici… sera construit ailleurs [A home refused here… will be built elsewhere] ↗
✼ Économiser pour consommer plus: la face cachée de la sobriété [Saving in order to consume more: the hidden side of “sobriété”] ↗
4. “To bring prices down, it is not quantity that matters but quality, so building more is pointless” = FALSE
No one has claimed that building is enough. But the balance between supply and demand cannot be removed from the equation that sets prices. The “yes, but building is not enough” is not a nuance: it is a permanent misalignment, which sows doubt exactly where action is needed.
4.1. The balance between supply and demand determines price.
Key concepts
✼ Price elasticity with respect to housing stock: the relationship between quantity and price has long been measured. An empirical rule has been observed by Jacques Friggit in France: a 1% increase in the housing stock corresponds to a 1 to 2% fall in prices. Taken in isolation, the effect seems “modest”. But it is cumulative: an area that builds at 2% a year for ten years would see its prices fall by 20 to 40%, all other things being equal. And the alternative (not building) does not stabilise prices: it drives them up, through scarcity.
✼ Correlation is not causation: “a lot is being built in Lyon and Bordeaux, and prices are rising” is a fallacy. Developers do not build where prices are falling; they build where demand (and prices) are rising. To isolate the specific effect of supply, economic studies compare areas subject to the same demand shock: for an equal shock, prices rise everywhere, but much more where supply is constrained by regulation.
Key figures
✼ +1% in housing stock → −1 to −2% in prices (Friggit). At 2%/year for ten years → −20 to −40%, all other things being equal.
✼ −22%: in Austin, 6.1 permits issued per 1,000 residents (six times the US average) brought rents down by 22% in three years.
✼ ~25%: in the South East of England, prices would have been around 25% lower if planning regulation there had been as flexible as in the North East of the country (Hilber & Vermeulen).
Key references
✼ Miet, D., Lévy, J., & Coldefy, J. (2026). Au-delà du malthusianisme urbain, YIMBY: pour une écologie de l'abondance et de l'accueil [Beyond urban Malthusianism, YIMBY: for an ecology of abundance and welcome] [right of reply]. Fonciers en débat. ↗
✼ Hilber, C. A. L., & Vermeulen, W. (2016). The Impact of Supply Constraints on House Prices in England. The Economic Journal, 126(591), 358-405. ↗
✼ Friggit, J. (2021, March). L'élasticité du prix des logements par rapport à leur nombre [The elasticity of housing prices relative to their number]. CGEDD (the former French General Council for the Environment and Sustainable Development). ↗
✼ Pew Charitable Trusts. (2026, March). Austin's Surge of New Housing Construction Drove Down Rents. ↗
Further reading
✼ Croire que construire plus ne sert à rien [Believing that building more is pointless] ↗
4.2. A high price can signal the quality of a property or of a location, but also a shortage.
Key concepts
✼ Price as a signal: a high price always says one of two things: either the property is exceptional (intrinsic scarcity: a view of the Eiffel Tower cannot be multiplied), or there is not enough of it (organised scarcity: that kind can be corrected by producing more). Confusing the two means mistaking shortage for quality, and thereby giving up on correcting it.
✼ Location, a genuine component of value: the NIMBY camp is right on one point: location has value, and that value soars with metropolisation and coastal concentration. But the conclusion is reversed: since place is what prevails, the answer is to house more people there (concentrating square metres on the best locations), not to organise scarcity there.
✼ Shortage is the condition for speculation, not the other way round: speculation, land hoarding and rent-seeking do not create scarcity: they feed on it. Holding on to a piece of land or a home is only a winning bet if one is certain that supply will remain blocked: it is the regulatory numerus clausus that guarantees the speculator’s return. Tackling speculation without producing means inverting cause and effect; producing means removing the speculator’s guarantee.
Key figures
✼ From 1 to 7: housing prices vary sevenfold across France — from Mirecourt (€850/m²) to Annecy (€6,000/m²). It is the place (its qualities, its urban character) that underpins value.
✼ From 1 to 50: the prices of building plots, for their part, vary fiftyfold. The gap between the two ratios (1–7 for housing, 1–50 for land) says it all: value does not lie in construction, whose cost is roughly uniform across the country — it lies in the right to build in that place. Land is the pure concentrate of locational scarcity.
✼ Below construction cost: where supply exceeds demand, prices collapse below the very cost of construction: €850/m² in Mirecourt, €1,000/m² in Vierzon and Tulle. Where they exceed €5,000 or €10,000/m², supply is systematically undersized.
Key references
✼ Miet, D. (2025, September 18). Trois scénarios pour faire grandir la côte ouest [Three scenarios for growing the West Coast]. Organic Cities II, Rennes. Sciences Po Rennes & Villes Vivantes. ↗
Further reading
✼ Si c'est trop cher, c'est: soit exceptionnel, soit qu'il n'y en a pas assez [If it is too expensive, it is either exceptional, or there is not enough of it] ↗
✼ L'importance de l'emplacement n'est pas nouvelle. Mais elle s'envole [The importance of location is not new. But it is soaring] ↗
✼ Faire jouer l'emplacement pour resserrer les mètres carrés et faire baisser les prix du logement [Leveraging location to concentrate square metres and bring housing prices down] ↗
✼ Plus construire coûte cher, plus l'emplacement devient la clé du logement abordable [The more expensive building becomes, the more location becomes the key to affordable housing] ↗
4.3. The knock-on effects of building housing, even expensive housing, benefit every segment of a property market.
Key concepts
✼ Moving chains: each new home opens a chain: a household moves in and vacates its former home, which is occupied by another household, whose home is vacated in turn, and so on. Housing is a second-hand market: only a small fraction of rental listings are new-build. It is through the stock that is freed up that new housing, even expensive, serves the whole market, including households that will never buy new.
✼ Filtering: today’s expensive home is tomorrow’s affordable home. The existing stock depreciates in relative terms as newer housing arrives above it, on one condition: that the flow of production never stops. Cutting production freezes filtering: the older stock remains expensive because nothing is growing above it.
✼ Gentrification: cause and effect inverted: new housing is accused of driving residents out of working-class neighbourhoods. The data show the opposite: it is the lack of new housing that causes displacement. When affluent demand arrives in a neighbourhood and nothing is built, it takes over existing homes by outbidding their occupants. New housing absorbs affluent demand; its absence spills that demand onto the older stock.
Key figures
✼ 100 → 60: in the Helsinki metropolitan area, for every 100 new market-rate homes built in the city centre, around 60 homes are freed up, through moving chains, in neighbourhoods in the lower half of the income distribution, within the first few years (Bratu, Harjunen & Saarimaa, 2023).
✼ −0.19%: in Germany, a 1% increase in new supply lowers average rents by 0.19%, reduces rents for lower-quality housing, and disproportionately increases the number of second-hand homes put back on the rental market (Mense, 2025).
✼ 5 to 7%: in the United States, a large new building in a low-income neighbourhood lowers surrounding rents by 5 to 7% compared with control neighbourhoods (Asquith, Mast & Reed, 2023).
Key references
✼ Bratu, C., Harjunen, O., & Saarimaa, T. (2023). JUE Insight: City-wide effects of new housing supply: Evidence from moving chains. Journal of Urban Economics, 133, 103528. ↗
✼ Mense, A. (2025). The Impact of New Housing Supply on the Distribution of Rents. Journal of Political Economy Macroeconomics, 3(1), 1-42. ↗
✼ Asquith, B. J., Mast, E., & Reed, D. (2023). Local Effects of Large New Apartment Buildings in Low-Income Areas. The Review of Economics and Statistics, 105(2), 359-375. ↗
✼ Wiebe, M. (2025). Filtering: How the expensive new homes of today become the affordable homes of tomorrow. Building Abundance. ↗
✼ Wiebe, M. (2026). Gentrification and displacement: New housing enables rich people to move in without displacing the poor. Building Abundance. ↗
Further reading
✼ Croire que construire plus ne sert à rien [Believing that building more is pointless] ↗
✼ Les effets positifs en cascade d'un choc de l'offre en logements [The positive knock-on effects of a housing supply shock] ↗
4.4. Shortage denial and supply scepticism.
Key concepts
✼ Shortage denial: a first stance, which consists of denying that there is a housing shortage, and substituting moral causes for it: speculation, financialisation, Airbnb, vacant homes. These phenomena exist; they thrive precisely on scarcity (see 4.2). Tackling them without producing is like treating a fever by breaking the thermometer.
✼ Supply scepticism: a second, subtler stance, which consists of acknowledging the shortage but doubting that building will change anything. “New housing is too expensive to help”, “it will only benefit the rich”, “it will gentrify”. Each of these objections now has its empirical rebuttal (4.1 to 4.3). Scepticism survives because it is comfortable: it makes it possible to acknowledge the problem while opposing its solution.
✼ A cognitive exception specific to housing: the public understands the law of supply and demand perfectly well in other markets. It is only for housing that intuition becomes muddled: rising prices are spontaneously attributed to ill will (developers, speculators, platforms) rather than to scarcity.
Key figures
✼ Only 30 to 40% of respondents believe that building more lowers prices and rents — whereas the same respondents give the right answer to the same question asked about wheat, cars or the labour market (Nall, Elmendorf & Oklobdzija, US national surveys, 2,500 to 3,000 adults).
Key references
✼ Demsas, J. (2022). Housing Breaks People's Brains. The Atlantic. ↗
✼ Nall, C., Elmendorf, C. S., & Oklobdzija, S. (2024). Folk Economics and the Persistence of Political Opposition to New Housing. ↗
Further reading
✼ Quand on nie la pénurie, on fabrique la crise [Denying the shortage manufactures the crisis] ↗
✼ Du déni de pénurie, au scepticisme à l'égard de l'offre [From shortage denial to supply scepticism] ↗
5. “We need to distribute jobs and population more evenly across France, so we should not build here but elsewhere, which ultimately means building less here” = FALSE
This reasoning is appealing because it opposes nothing and no one, and merely shifts a badly framed problem in theory. Behind the apparent generosity of “rebalancing” lies a threefold error: the concentration of jobs has powerful economic reasons (5.1), the concentration of population expresses legitimate desires (5.2), and this twofold concentration is a climate asset, not a threat (5.3). As for demand, no decree can redistribute it (5.4).
5.1. Today’s employment is spatially concentrated because we change jobs more and more often.
Key concepts
✼ Labour market thickness: a century of economic research, from Marshall (1920) to Diamond (1982) and on to Moretti & Yi (2024), has established the robustness of this mechanism: the more employers and workers a labour market has, the more precise, rapid and lasting the matching between skills and jobs. The big city acts as insurance against job loss.
✼ The law of turnover: “The size of the city you need to live in is roughly proportional to the number of times you will change jobs” (Miet, Les Echos, 2026). With a new job every four years, and two specialised careers per couple, settling in an urban area of 10,000 or 20,000 people has become impossible — unless one moves house constantly.
✼ The survey/behaviour paradox: 84% of French people say they prefer medium-sized towns to large cities (IFOP (a French polling institute)/Villes de France, 2020). Yet migration flows and prices show the opposite. What people decide when they move involves their job, their partner’s job and their family’s economic security.
Key figures
✼ 1 young person in 4: a quarter of young people who entered the labour market in 2017 had already left their CDI (a French permanent employment contract) three years later, compared with 17% for the 2010 cohort (Céreq (the French centre for research on qualifications), 2026). And 41% of young graduates no longer make a CDI a priority (EDHEC–JobTeaser barometer, February 2026).
✼ 640 versus 9: within a 32 km radius, a worker in a “thick” market has access to a median of 640 firms in their sector; in a “thin” market, to 9 — seventy times fewer potential employers on the day their company closes (Moretti & Yi, 2024).
✼ +19% in wages, −25 points in relocation: after their company closes, a skilled worker in a thick market is 10.7 percentage points more likely to find a job within 12 months, earns a wage 19% higher a year later, and is 25 points less likely to have to move (Moretti & Yi, 2024).
✼ 37% of jobs on 7% of the land area: the most sought-after areas of France concentrate more than a third of jobs, and 49% of population growth (Villes Vivantes, based on INSEE (the French national statistics office) and DVF (the French property transactions database)).
Key references
✼ Miet, D. (2026, July). Plus nous changeons d'emploi, plus nous avons besoin de grandes villes [The more we change jobs, the more we need big cities]. Les Echos.
✼ Moretti, E., & Yi, M. (2024). Size Matters: Matching Externalities and the Advantages of Large Labor Markets. NBER Working Paper No. 32250. ↗
✼ Timbeau, X. (2024, January 19). Modéliser l'accessibilité aux emplois [Modelling access to jobs]. Organic Cities, Paris. Sciences Po & Villes Vivantes. ↗
✼ Merlin, F. (2026, March). Ruptures choisies, ruptures subies: le CDI à l'épreuve des secteurs en début de carrière [Chosen departures, forced departures: the permanent contract put to the test by sector at the start of careers]. Céreq Bref, No. 482. ↗
Further reading
✼ Pourquoi les jeunes actifs s'installent en métropole (alors qu'ils rêvent de villes moyennes) [Why young workers settle in large cities (when they dream of medium-sized towns)] ↗
✼ Le prix de l'accès aux emplois [The price of access to jobs] ↗
5.2. Spatial concentration is also hedonistic.
Key concepts
✼ Heliotropism, a long-term trend: for half a century, French people have been migrating towards the sun, the sea and amenities: the Atlantic and Mediterranean coasts, the South West, Alpine valleys. This movement has survived every crisis. Remote working has not dispersed demand: it has released it towards the areas people desire, by partially decoupling where people live from where they work.
✼ Amenities are capitalised into prices: climate, landscape, access to the sea and urban quality come at a price, and their value is built into property prices. A price map is a map of revealed desires: French people vote with their removal vans and their euros.
✼ Ageing amplifies the geography of desire: retirees, freed from employment constraints, choose where to live on amenities alone: and their numbers grow every year. Hedonistic demand is not a post-Covid fad: it is a demographic groundswell.
✼ There is no arguing with a map of desires: wanting to “distribute the population” so as to avoid building in the places where desires are concentrated means asking French people to desire something other than what they desire. Yet the freedom to settle where one chooses is a right that everyone exercises according to their means.
Key figures
✼ 4 times faster: the West Coast départements are experiencing population growth (2016–2022) four times higher than the rest of France: 0.8%/year compared with 0.2%/year (Pouvreau, Organic Cities II, 2025).
✼ 105 km: a quarter of people who change municipality now travel more than 105 km, compared with 88 km before the Covid crisis (INSEE, Insee Première No. 2073).
✼ +0.5%/year: Brittany, Occitanie and Nouvelle-Aquitaine each gain more than 5 residents per 1,000 per year through internal residential mobility alone (INSEE, Insee Première No. 2073).
Key references
✼ Miet, D. (2025, September 18). Trois scénarios pour faire grandir la côte ouest [Three scenarios for growing the West Coast]. Organic Cities II, Rennes. ↗
✼ Pouvreau, L. (2025, September 18). La Côte Ouest française face à son potentiel démographique [The French West Coast and its demographic potential]. Organic Cities II, Rennes. ↗
✼ Brutel, C. (2025). Les mobilités résidentielles en France [Residential mobility in France]. Insee Première, No. 2073. ↗
Further reading
✼ Le chemin du désir français [The path of French desire] ↗
✼ On va manquer de logements… dans un pays où la population ne croît presque plus [We are going to run short of housing… in a country where the population is barely growing] ↗
5.3. Spatial concentration is an asset for decarbonising our lifestyles.
Key concepts
✼ Dispersing means motorising: territorial dispersion mechanically lengthens everyday distances and makes the car indispensable. Conversely, concentration shortens journeys, makes public transport viable, and makes cycling and walking possible.
✼ Accommodating people in the centre, the dormant climate lever: every household housed in the heart of an urban area rather than on the distant periphery represents an emissions differential secured for decades, with no daily effort and no new technology (see Part 3).
Key figures
✼ From 3.4 to 14.7 t CO2/year of mobility for the same household of four, depending on its municipality of residence (SCoT (a French sub-regional strategic plan) La Rochelle Aunis).
Key references
✼ Miet, D. (2024, January 19). Devrions-nous rénover tous les bâtiments bien que certains soient éloignés des centres urbains ou construire plus de logements neufs au cœur des agglomérations? [Should we renovate all buildings even though some are far from urban centres, or build more new homes in the heart of urban areas?] Organic Cities, Paris. ↗
Further reading
✼ Pourquoi la dispersion territoriale sabote notre politique climatique [Why territorial dispersion is sabotaging our climate policy] ↗
5.4. Demand cannot be redistributed by decree, but we can, on the other hand, thicken our second-tier cities.
Key concepts
✼ The fantasy of territorial redistribution: “we must build elsewhere” assumes that an authority can direct flows: decide where households will settle, where companies will hire. This deus ex machina does not exist, and it would be incompatible with the freedom to settle where one chooses.
✼ “Elsewhere” is a refusal in disguise: coming from the NIMBY camp, “building elsewhere” never refers to a place: it is a way of passing the problem on. The practical conclusion of the reasoning is always “build less here”, where the needs are most pressing.
✼ Thickening second-tier cities: the question facing spatial planners is not to “rebalance” areas against the real movement of concentration, but to give Lyon, Bordeaux, Nantes, Rennes, Toulouse, Montpellier… sufficient thickness so that they too can offer job security and economic freedom.
Key references
✼ Miet, D., Lévy, J., & Coldefy, J. (2026). Au-delà du malthusianisme urbain, YIMBY [Beyond urban Malthusianism, YIMBY]. Fonciers en débat. ↗
✼ Miet, D. (2026, July). Plus nous changeons d'emploi, plus nous avons besoin de grandes villes [The more we change jobs, the more we need big cities]. Les Echos.
6. “We need to plant more, so we need to build less.” = FALSE
This reasoning rests on a false equivalence: more buildings = less vegetation. It seems obvious, but observation contradicts it: a city's vegetation cover does not depend on the amount of open space, but on what city dwellers do with that open space.
6.1. The dense, compact city is not incompatible with increasing vegetation cover.
Key concepts
✼ Density and vegetation cover are two independent variables: the first measures homes per hectare, the second the area of tree canopy and planting. Densifying does not require removing plants: we plant streets, courtyards, boundaries, roofs and walls.
✼ Urban trees cope with density: what determines a tree's growth is not the density of the neighbourhood, but its access to water and the care it receives until maturity.
✼ Buildings protect trees: the shade cast by buildings reduces the radiation that dries trees out and conserves their water reserves. The compact city can extend their resilience during droughts.
Key figures
✼ Denser AND greener, over 20 years: in Denmark, between 1995 and 2016, residential areas gained both population density and vegetation cover. Greening was strongest in the three large cities that densified the most (Copenhagen, Aarhus, Odense).
✼ 6,646 trees, 11 years, no effect of density: in Melbourne, the monitoring of 6,646 trees of three native species, from 2009 to 2020, concludes that density and urban form have very little impact on tree growth. The decisive factor is access to water, not density.
✼ −55 to −66% transpiration in the shade: in Berlin, the monitoring of street lime trees shows that at the times of day when buildings shade them, their transpiration falls by 55 to 66% (Tams et al., 2024).
✼ 70 to 80%: the share of daytime cooling under a tree that comes from the shade it casts, and not from evapotranspiration (systematic review, Knight et al., 2021).
Key references
✼ Samuelsson, K., et al. (2021). Residential environments across Denmark have become both denser and greener over 20 years. Environmental Research Letters, 16. ↗
✼ Ren, X., Torquato, P. R., & Arndt, S. K. (2023). Urban density does not impact tree growth and canopy cover in native species in Melbourne, Australia. Urban Forestry & Urban Greening, 81, 127860. ↗
Further reading
✼ Bâtir ou planter: le faux dilemme [Building or planting: the false dilemma] ↗
✼ Danemark: augmenter simultanément la densité urbaine et la part du végétal en ville [Denmark: increasing urban density and the share of vegetation in the city at the same time] ↗
✼ La densité urbaine impacte peu la croissance des arbres [Urban density has little impact on tree growth] ↗
6.2. It is the gardener who determines the share of vegetation, not large open spaces.
Key concepts
✼ The size of a plot does not predict how rich its vegetation is — the gardener does: everywhere there are plots that are both heavily built and heavily planted, and large, sparsely built plots covered in closely mown lawn. What counts is how the occupants use and care for them.
✼ Dividing gardens multiplies gardeners: the large, low-density garden is overwhelmingly given over to lawn: poor in biodiversity, weak at cooling. Reducing its size means matching it to what its gardener can manage, and the gardener then develops dense, layered vegetation.
✼ A free workforce for nature in the city: thousands of private individuals looking after their plots are a considerable force that places no burden on public budgets.
Key references
✼ Hanss, T., & Miet, D. (2024). Épargner et partager: les deux clés qui peuvent faire de la densification douce un outil au service du renforcement de la biodiversité [Sparing and sharing: the two keys that can make gentle densification a tool for strengthening biodiversity]. Organic Cities. ↗
Further reading
✼ Densifier et jardiner [Densifying and gardening] ↗
✼ Des parcelles à la fois très bâties et très plantées, ça existe? [Plots that are both heavily built and heavily planted: do they exist?] ↗
6.3. The dense, compact city can be put to work for planting.
Key concepts
✼ Trees need shade, just like us: the buildings around a tree cast shade that reduces the radiation it receives, conserves its water reserves and delays drought stress. In dense areas, buildings provide the baseline of thermal comfort, and trees amplify it.
✼ Density does not leave trees thirsty — the way space is designed does: what deprives a tree of water is not the compactness of the neighbourhood, but the sealing of the soil beneath its crown. And the dense city offers a lever that the housing development lacks: its large neighbouring impermeable surfaces can be connected to the tree pit to water the tree.
✼ Buildings as a support and shelter for living things: walls store heat that protects plants from the cold and support climbing plants and their ecosystems; the enclosed courtyard creates a sheltered microclimate. The giardino pantesco keeps citrus trees alive thanks to the building, not in spite of it.
Key figures
✼ 4× / 10× / 19×: street trees are four times more effective than reflective roofs, ten times more effective than green roofs and nineteen times more effective than light-coloured paving (Jiang et al., PNAS, 2025).
✼ −89% drought stress: connecting an impermeable surface roughly three times larger to the pit of a young street lime tree eliminates up to 89% of episodes of severe drought stress (Tams et al., Berlin, 2024).
✼ 76% of urban tree species at risk by 2050: of 3,129 species assessed in 164 cities, more than three quarters will be exposed to heat risk by 2050 (Esperon-Rodriguez et al., Nature Climate Change, 2022).
Key references
✼ Jiang, T., et al. (2025). Prioritizing Urban Heat Adaptation Infrastructure Based on Multiple Outcomes. PNAS, 122(19). ↗
✼ Tams, L., Paton, E., & Kluge, B. (2024). Urban Tree Drought Stress. Science of the Total Environment, 957, 177221. ↗
✼ Esperon-Rodriguez, M., et al. (2022). Climate Change Increases Global Risk to Urban Forests. Nature Climate Change, 12(10), 950-955. ↗
Further reading
✼ Nous plantons des arbres pour nous faire de l'ombre, mais ils en ont besoin autant que nous [We plant trees to give ourselves shade, but they need it as much as we do] ↗
✼ La ville dense condamne-t-elle vraiment l'arbre à souffrir de la soif? [Does the dense city really condemn trees to suffer from thirst?] ↗
✼ Le giardino pantesco: quand le bâti rend la vie possible [The giardino pantesco: when buildings make life possible] ↗
✼ Entre le mur et la plante grimpante, tout un écosystème à portée de main [Between the wall and the climbing plant, a whole ecosystem within reach] ↗
7. “The priority is to renovate the existing stock faster and bring vacant homes back into use, so we need to build less” = FALSE
Renovating the existing stock is useful, and nobody disputes that. The question is not whether we should renovate (the answer is yes, in some cases) but whether renovating means we no longer need to build. On this specific point, renovation alone cannot meet housing needs. There are three reasons: renovating does not increase the number of homes (7.1), the vacant stock that can be brought back into use is limited (7.2), and the stock needing renovation is not where the need is concentrated (7.3).
7.1. Renovating improves the stock without increasing the number of homes.
Key concepts
✼ Renovating transforms, building adds: renovation concerns a home that already exists. It is necessary work, but it leaves the number of homes unchanged. Building, by contrast, increases the stock. These are two different kinds of action, meeting two different needs: the quality of the stock for one, its quantity for the other.
✼ Housing need is largely a net need: every year, additional households are formed as a result of household splitting, separations and ageing (Part 1.1). These new households need additional homes, which only net production can provide.
✼ Between renovating and building, a whole gradient of intensification: reconfiguring, extending upwards, extending outwards and subdividing existing buildings creates additional homes from the existing stock, without sprawl. This is no longer simple renovation, it is gentle densification (Part 2).
✼ Renovation and construction are not opposed, they add up: since one addresses quality and the other quantity, setting them against each other amounts to choosing between caring and welcoming. A comprehensive housing policy does both.
Further reading
✼ On va manquer de logements… dans un pays où la population ne croît presque plus [We are going to run short of housing… in a country where the population has almost stopped growing] ↗
✼ Une OPAH peut-elle aider des jeunes à s'installer et rénover sur le territoire? [Can an OPAH (a French subsidised programme for improving private housing) help young people settle and renovate in the area?] ↗
✼ Il vaut mieux densifier que rénover [It is better to densify than to renovate] ↗
7.2. Bringing vacant homes back into use can help, but it is far from enough.
Key concepts
✼ Recorded vacancy is not an available stock: the 3.1 million “vacant” homes on record combine unrelated situations. A large share is frictional or undergoing works, in undivided joint ownership, or too dilapidated to live in. The stock that can actually be brought back into use is much smaller than the headline figure.
✼ The usable reserve is where demand is not: long-term vacancy is concentrated in declining areas, the ones households are leaving. Where demand is soaring, the smallest habitable home is already taken. The geography of usable vacancy is the reverse of the geography of need.
✼ Vacancy is necessary: a market with no vacancy at all is one where people fight over every home, where rents soar and where people can no longer move to change jobs. Frictional vacancy is the margin that keeps a market fluid and affordable.
Key figures
✼ 3.1 million “vacant” homes, or 8.2% of the stock: the figure brandished to say “we already have everything we need”. But it is mostly made up of frictional vacancy and vacancy caused by decline; the stock that can be brought back into use where demand exists is a small fraction of it (INSEE, the French national statistics office).
Further reading
✼ Des outils pour résorber la vacance du parc de logements [Tools for reducing vacancy in the housing stock] ↗
✼ L'outil de repérage Zéro Logement Vacant [The Zéro Logement Vacant (Zero Vacant Housing) identification tool] ↗
✼ Lutter à l'extrême contre la vacance des logements, est-ce lutter contre les loyers abordables? [Is fighting housing vacancy to the extreme a fight against affordable rents?] ↗
✼ Mobiliser les logements vacants pour répondre aux besoins en logements? [Bringing vacant homes back into use to meet housing needs?] ↗
✼ Vacance de rêve à Paris [Dream vacancy in Paris] ↗
✼ Les opérations BIMBY au service de l'habitat ancien: densifier et rénover [BIMBY operations serving older housing: densifying and renovating] ↗
8. “We need to save soils and biodiversity, so we need to build less” = FALSE
Saving soils and biodiversity is a sound objective, and one we fully share. This reasoning confuses two scales: what we think we are sparing by not building here is paid for by destruction elsewhere, on the edges of cities, on irreplaceable natural and agricultural soils.
8.1. What is at stake for biodiversity and soils lies first and foremost outside the city.
Key concepts
✼ Irreplaceable nature is not in the city: soils that have never been subject to land take, meadows, forests and intact habitats are home to threatened species that will never find a place in the city. It is this nature that every hectare consumed by sprawl directly threatens.
✼ Fight sprawl, not density: we have only two options for housing those who can no longer find a home. One is to densify the existing city, the other is to spread it over fields, forests and natural areas. Rejecting the first option means choosing the second by default.
Key figures
✼ 637 wild plant species in Paris: the densest city in Europe is home to 637 species of spontaneous flora: living proof that a very dense city can host rich biodiversity (Machon et al., 2025).
✼ Half of the flora of Île-de-France on a fraction of the area: an area's ecological richness does not depend on its gross surface, but on the heterogeneity and management of its habitats (Machon et al., 2025).
Key references
✼ Machon, N., et al. (eds.). (2025). Écologie urbaine: connaissances, enjeux et défis de la biodiversité en ville [Urban ecology: knowledge, issues and challenges of biodiversity in the city]. Éditions Quæ. ↗
Further reading
✼ Protéger la nature en ville, ou protéger la nature de la ville? [Protecting nature in the city, or protecting nature from the city?] ↗
✼ Faut-il protéger la nature en ville au point de sacrifier celle autour? [Should we protect nature in the city to the point of sacrificing the nature around it?] ↗
✼ Comment la densification douce des tissus bâtis existants peut nous aider à préserver les terres naturelles [How gentle densification of the existing built fabric can help us preserve natural land] ↗
8.2. Refusing to build here means land take elsewhere.
Key concepts
✼ The displacement effect, as with carbon: when local planning regulations (PLU) refuse densification, housing demand does not evaporate: it shifts to the periphery, where it consumes agricultural and natural land, on a scale out of all proportion to the land “saved” in the city.
✼ The visibility heuristic: we protect what we see. Our neighbour's garden is part of our everyday living environment; the field turned into a housing development fifty kilometres away is nobody's living environment. And it is this field, whose degradation is irreversible, that pays the price of refusing to densify.
✼ Not all soils are equal: making all soil sacred without distinction — giving a suburban garden the same status as a natural meadow — makes any trade-off impossible.
Key figures
✼ 64% of the consumption of natural and agricultural land goes to building housing: it is housing, and its sprawling form, that devours soils first and foremost (Cerema, a French public agency for planning and environmental expertise, 2009-2023 data).
✼ 58% of this land take occurs in low-pressure areas: precisely where most agricultural land lies, and where building happens because high-demand areas have not been densified (Cerema, 2026).
✼ Cleveland: 1,400 hectares “given back to nature”… and 80,000 residents gone: this recovered nature is the product of demographic collapse. The 80,000 residents who left found homes elsewhere, consuming soils in the process (Machon et al., 2025).
Key references
✼ Cadot, R., & Di Salvo, M. (2026). L'Observatoire national de l'artificialisation des sols [The National Observatory of Land Take]. Annales des Mines — Responsabilité & Environnement, no. 122. ↗
✼ Hanss, T. (2026). Préserver les sols en ville, c'est délocaliser la destruction des sols là où ils comptent vraiment [Preserving soils in the city means relocating soil destruction to where soils really matter]. Villes Vivantes. ↗
Further reading
✼ Sobriété immobilière ici, gaspillage foncier là-bas? [The politics of building scarcity here, land waste over there?] ↗
✼ Cleveland: 1 400 hectares rendus à la nature. Combien de perdus ailleurs? [Cleveland: 1,400 hectares given back to nature. How many lost elsewhere?] ↗
✼ Silos + loupes + œillères: le trio gagnant de l'erreur urbanistique [Silos + magnifying glasses + blinkers: the winning trio of planning error] ↗
8.3. Freezing the city in the name of living things impoverishes living things.
Key concepts
✼ A garden under a glass dome is not a living garden: freezing the urban fabric prevents it from living and adapting. A garden is only alive if it is looked after by someone who has the time and ability to do so. Protecting the plot as a sanctuary without asking who gardens it means protecting the container while letting the contents die.
✼ A garden that outgrows its gardener turns to hard surfaces: the typical occupant of a detached house is 60 years old, and single-family neighbourhoods are ageing all at once. When the size of the garden exceeds what its gardener can manage, closely mown lawn takes over, if artificial grass does not take its place.
✼ Gentle densification brings the garden back to the scale of its gardener: dividing a large plot means entrusting each part to a household able to look after it. Two human-scale gardens can be tended by twice as many gardeners.
Key figures
✼ +12% in one year: France has become the third-largest European market for artificial grass, growing by 12% in 2024, with 80% of sales to private individuals (Leroy Merlin Source, 2026).
✼ +16 °C, and dead soil: in summer, artificial grass gets 16 °C hotter than natural grass, releases microplastics and PFAS, and sterilises the soil (ECHA, the European Chemicals Agency; Stockholm University, 2022).
✼ 60 years: the average age of the main occupant of a detached house; and single-family neighbourhoods are ageing all at once, with no renewal of their gardeners where the fabric is frozen (Leroy Merlin Source, 2026).
Key references
✼ Leroy Merlin Source. (2026). Composer avec le vivant: pratiques du jardin dans le pavillonnaire périurbain [Working with living things: gardening practices in peri-urban single-family neighbourhoods]. ↗
✼ Hanss, T. (2026). +12% en un an: ce que le boom du gazon synthétique dit (vraiment) de nos jardins [+12% in one year: what the artificial grass boom (really) says about our gardens]. Villes Vivantes. ↗
Further reading
✼ L'arbre (et le paysagiste) qui cache la pelouse [The tree (and the landscape designer) hiding the lawn] ↗
✼ Faut-il figer le tissu urbain au nom du vivant? [Should the urban fabric be frozen in the name of living things?] ↗
✼ La mise sous cloche du tissu pavillonnaire n'est pas soutenable [Putting single-family neighbourhoods under a glass dome is not sustainable] ↗
8.4. Densifying is our best lever for soils and biodiversity: land sparing and land sharing.
Key concepts
✼ Two strategies that ecology sets against each other, and that gentle densification reconciles: gentle densification does both at once: it concentrates housing, which spares the natural and agricultural soils outside (sparing); and it multiplies gardeners, which enriches living things inside (sharing).
✼ A small garden is a better ecological lever than a large one: dividing activates three drivers: appropriation, the diversity of gardeners, and the mosaic effect (placing side by side gardens managed in different ways creates the heterogeneity of habitats on which biodiversity depends).
✼ Recognising the nature of the city: the city is not an impoverished environment to be defended, it is an environment in its own right. Walls and façades are cliffs for rock-dwelling flora and fauna; gardens form a mosaic comparable to a forest edge.
Key figures
✼ 86% lawn: in large suburban gardens, lawn (an almost single-species habitat) takes up the overwhelming majority of the surface (Hanson et al., 2021).
✼ Biodiversity ×7 in 3 years: on a 250 m² plot entrusted to a committed gardener, the number of species observed increased sevenfold (Mata et al., 2023).
✼ 300 kg on 50 m²: the annual output of an intensive urban vegetable garden; ecological and food productivity per square metre rises as the plot shrinks and care becomes concentrated (Chauffrey, 2023).
Key references
✼ Hanss, T., & Miet, D. (2024). Épargner et partager: les deux clés qui peuvent faire de la densification douce un outil au service du renforcement de la biodiversité [Sparing and sharing: the two keys that can make gentle densification a tool for strengthening biodiversity] [meta-analysis]. Organic Cities. ↗
✼ Machon, N., et al. (eds.). (2025). Écologie urbaine: connaissances, enjeux et défis de la biodiversité en ville [Urban ecology: knowledge, issues and challenges of biodiversity in the city]. Éditions Quæ. ↗
Further reading
✼ Densification douce et biodiversité: pourquoi le “petit” jardin est un meilleur levier de transition? [Gentle densification and biodiversity: why is the “small” garden a better lever for transition?] ↗
✼ Sols fertiles: protéger les jardins ou accueillir des jardiniers? [Fertile soils: protect gardens or welcome gardeners?] ↗
✼ Le moteur sous-estimé de la biodiversité urbaine: la diversité des habitants [The underestimated driver of urban biodiversity: the diversity of residents] ↗
✼ Quand la ville invente ses écosystèmes [When the city invents its own ecosystems] ↗
9. “We need to cool cities, so we need to build less” = FALSE
Cooling cities is imperative, and the urgency is real. During long and intense heatwaves, protecting people depends first and foremost on active cooling, in other words air conditioning. But for most hot periods, urban form and planting can provide a significant share of everyday comfort. And this is where the NIMBY camp's equation, “dense and hard-surfaced = hot VS green = cool”, proves false on two counts.
9.1. Summer comfort comes from shade, and shade comes first and foremost from buildings.
Key concepts
✼ What cools a body is shade, not air temperature: in a heatwave, what overwhelms passers-by is direct solar radiation. Moving into the shade changes everything, even if the air temperature barely shifts. Yet trees have no monopoly on shade: a narrow street, a deep courtyard, a porch or arcades cast just as much.
✼ The tree as air conditioner is a misleading shortcut: the image of the tree as a “natural air conditioner” rests on evapotranspiration. But this mechanism plays only a marginal role, and only when the tree is well supplied with water. Most of the cooling felt under a tree comes from its shade, not its transpiration.
✼ The photogenic myth is costly: “one tree is worth five air conditioners” makes for a good news report, not good policy. Cities plant trees in the middle of open esplanades, in full sun, on impermeable ground, where they die of thirst within a few summers without having cooled anyone.
Key figures
✼ 70 to 80%: the share of the cooling felt under a tree that comes from its shade, and not from its evapotranspiration (meta-analysis, Knight et al., 2021).
✼ −0.76 °C: the actual average effect of urban trees on air temperature — forty times less than the “−30 °C” brandished in news reports, which measure ground surface temperature (Knight et al., 2021).
✼ 58 °C on the ground, 27 °C under the tree… in a street already shaded by buildings: the shade credited to the tree is in fact that of the urban form.
Key references
✼ Knight, T., Price, S., Bowler, D., et al. (2021). How effective is urban greening at reducing land surface and air temperatures? Environmental Research Letters, 16(3), 033002. ↗
✼ Hanss, T. (2026). On nous montre l'arbre. C'est l'ombre qu'il fallait regarder [We are shown the tree. It was the shade we should have been looking at]. Villes Vivantes. ↗
Further reading
✼ L'arbre en ville n'est pas un climatiseur miracle: 7 idées reçues à revisiter [Urban trees are not miracle air conditioners: 7 received ideas to revisit] ↗
✼ 1 arbre = 5 climatiseurs: le calcul est juste, la conclusion est fausse [1 tree = 5 air conditioners: the calculation is right, the conclusion is wrong] ↗
✼ Création d'îlots de fraîcheur: pourquoi nous ne devrions pas opposer le végétal et le minéral [Creating urban cool islands: why we should not set greenery against hard surfaces] ↗
9.2. The dense, compact neighbourhood is a form of passive air conditioning.
Key concepts
✼ Dense built form cools, and we have known this for centuries: narrow streets, deep courtyards, the high thermal inertia of thick walls: long before any air conditioning, the urban fabric of hot climates developed an architecture of cooling. The inner courtyard acts as a cool well: it traps cool night air, shades itself for much of the day and encourages ventilation by convection.
✼ The hotter the climate, the denser and more compact buildings need to be: if density made places hotter, the cities of scorching regions would be the most open. The opposite is true: the harsher the summers, the more historic centres multiply narrow, compact courtyards.
✼ Density outperforms greening in cooling the air: the passive cooling achieved by dense built form is more intense than that provided by urban greening.
Key figures
✼ 6.8 to 14.3 °C cooler in a courtyard, when the outside air exceeds 40 °C: in Córdoba and Seville, the inner courtyard reduces air temperature by 6.8 to 14.3 °C during heat peaks, far beyond the 3 to 5 °C provided by urban greening according to ADEME (the French Agency for Ecological Transition).
✼ 82% versus 41%: in Córdoba (scorching summers), 82% of the 4,524 plots analysed have a courtyard; in Santiago de Compostela (mild summers), only 41% (Rojas-Fernández et al., 2017).
✼ A measured difference of 6.7 °C: in Córdoba, one reading recorded 38 °C on the roof compared with 31.3 °C in the courtyard at 3 pm, because the buildings shade 85% of the courtyard's surface at midday (Rojas-Fernández et al., 2017).
Key references
✼ Rojas-Fernández, J., et al. (2017). Correlations between GIS-Based Urban Building Densification Analysis and Climate Guidelines for Mediterranean Courtyards. Sustainability, 9(12), 2255. ↗
✼ Galán-Marín, C., et al. (2021). Enhancing Urban Microclimates Towards Climate-Resilient Cities: The Potential of Courtyards. ↗
Further reading
✼ Bologne, ou quand le quartier le plus dense, minéral et sans verdure est le plus frais de la ville [Bologna, or when the densest, most hard-surfaced neighbourhood with no greenery is the coolest in the city] ↗
✼ De l'Andalousie à Kyoto: quand la densité bâtie est une réponse au climat [From Andalusia to Kyoto: when built density is a response to climate] ↗
✼ Du nord au sud de l'Espagne: quand la morphologie des cours intérieures s'adapte au climat [From the north to the south of Spain: when the morphology of inner courtyards adapts to climate] ↗
9.3. Our tools measure what does not count, and wrongly condemn density.
Key concepts
✼ The urban heat island measures the air, not the body: the urban heat island (UHI) indicator compares a neighbourhood's air temperature with that of the surrounding countryside. Yet in a heatwave it is not the air that overwhelms passers-by, but the solar radiation their bodies receive. The UHI is blind to shade: a compact neighbourhood, largely shaded by its own form, shows up “red” on the UHI even though it offers pedestrians far greater real comfort.
✼ The McNamara fallacy: we measure what is easy to measure (the share of hard surfaces, vegetation and water on the ground) and decree that the rest does not count. ADEME itself warns that these measurements give only a “very partial” view and risk leading to “false conclusions”.
Key figures
✼ +2.5 °C at night on the UHI, but not a single hour of severe heat stress during the day: in Saint-Denis, Réunion, the compact neighbourhood records up to 2.5 °C more than the countryside at night but never crosses the threshold of very strong heat stress (Lefevre et al., 2026).
✼ 50-70% comfort in the compact city, less than 25% in single-family neighbourhoods: in Aachen, simulation shows that during the day the compact city centre retains 50 to 70% thermal comfort, while single-family neighbourhoods fall below 25% (Abdeyazdan & Santucci, 2026).
✼ Bologna, “Europe's deadliest city in a heatwave”… and its dense neighbourhood the coolest: the contradiction pits a reading based on the UHI (air, at night) against a reading based on real comfort (shade, during the day). It illustrates exactly the trap of the indicator.
Key references
✼ Lefevre, A., et al. (2026). Outdoor Thermal Comfort versus Urban Heat Island Intensity. Urban Climate, 67, 102913. ↗
✼ Abdeyazdan, S., & Santucci, M. F. (2026). Introducing the T-MCCR Index for Evaluating Urban Thermal Comfort Across Morphologies Under Climate Change. Urban Science, 10(3), 123. ↗
✼ ADEME. (2024). Diagnostic de la surchauffe urbaine — Méthodes et retours d'expérience [Diagnosing urban overheating — Methods and lessons learned]. ↗
Further reading
✼ Îlot de chaleur urbain: une lecture de la ville qui masque l'effet protecteur de la densité [Urban heat island: a reading of the city that masks the protective effect of density] ↗
✼ Le sophisme de McNamara appliqué à la surchauffe urbaine [The McNamara fallacy applied to urban overheating] ↗
✼ Bologne, ville la plus meurtrière d'Europe en canicule? [Bologna, Europe's deadliest city in a heatwave?] ↗